Starbucks Project

- High-level overview:
This blog is going to investigate a dataset provided by Starbucks. This dataset includes loads of information about their customers, their offers (promotions). By merging three separate tables, this project illustrates some main points about data, some problems which can be fixed, and also, discuss about how to predict using existing features.
Problem domain
This project is going to find out the possibility of predicting the Starbuck users' behaviour in response to offers given.
Project origin
This data set contains simulated data that mimics customer behavior on the Starbucks rewards mobile app.
- Description of Input Data
Data sets
- portfolio.json - containing offer ids and meta data about each offer.
- profile.json - demographic data for each customer
- transcript.json - records for transactions, offers received, offers viewed, and offers completed.
portfolio.json
- id (string) - offer id
- offer_type (string) - type of offer ie BOGO, discount, informational
- difficulty (int) - minimum required spend to complete an offer
- reward (int) - reward given for completing an offer
- duration (int) - time for offer to be open, in days
- channels (list of strings)
profile.json
- age (int) - age of the customer
- became_member_on (int) - date when customer created an app account
- gender (str) - gender of the customer (note some entries contain 'O' for other rather than M or F)
- id (str) - customer id
- income (float) - customer's income
transcript.json
- event (str) - record description (ie transaction, offer received, offer viewed, etc.)
- person (str) - customer id
- time (int) - time in hours since start of test. The data begins at time t=0
- value - (dict of strings) - either an offer id or transaction amount depending on the record
Problem Statement
This project aims to predict the effect of offer on buyers' behaviour.
- Strategy for solving the problem
Investigating data; Cleaning data; Merging data; EDA; Modelling and Predicting. In the modelling section, the project uses Random Forest Classifier as the main method.
- Expected solution
Modelling based on a consolidated dataframe from three original tables: portfolio, profile and transcript. I hope to find out meaningful variables which have effects on decision of Starbucks users
- Metrics
As the model aims to predict event_transaction - a binary variable - F1 score would be incorporated to determine whether the model is doing well as F1 score is the harmonic mean of precision and recall and is a better measure than accuracy.
- Investigating data
In the beginning, each project is examined (by having a peek at top 5 rows - df.head()). This helps us understand how many columns there are and what data type of each column is.


- EDA
Clean data
First, the portfolio is being examined. Here, I change name of id to offer_id to distinguish from user_id. Then, I create dummy features for channels column.
Second, in the profile table, I rename id to user_id to distinguish from offer_id. After that, became_member_on column is formatted to datetime.
Third, in the transaction, I rename id to user_id to distinguish from offer_id. After finding out that there are four unique values in event column, which are 'offer received', 'offer viewed', 'transaction', 'offer completed', I get dummy variables of these. Finally, in value column, I find something stored in terms of dictionary. I extract them out to two separate columns: offer_id and amount.
Last, I merge three tables together using mutual columns.
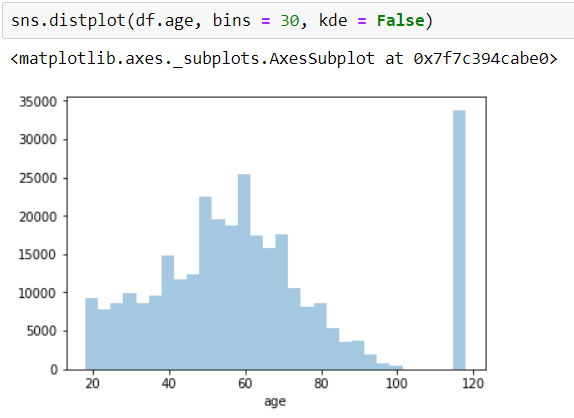
Data visualisation
As you might have a look on the histogram, there is probably an outlier at age 118. My decision is to remove this row from df.
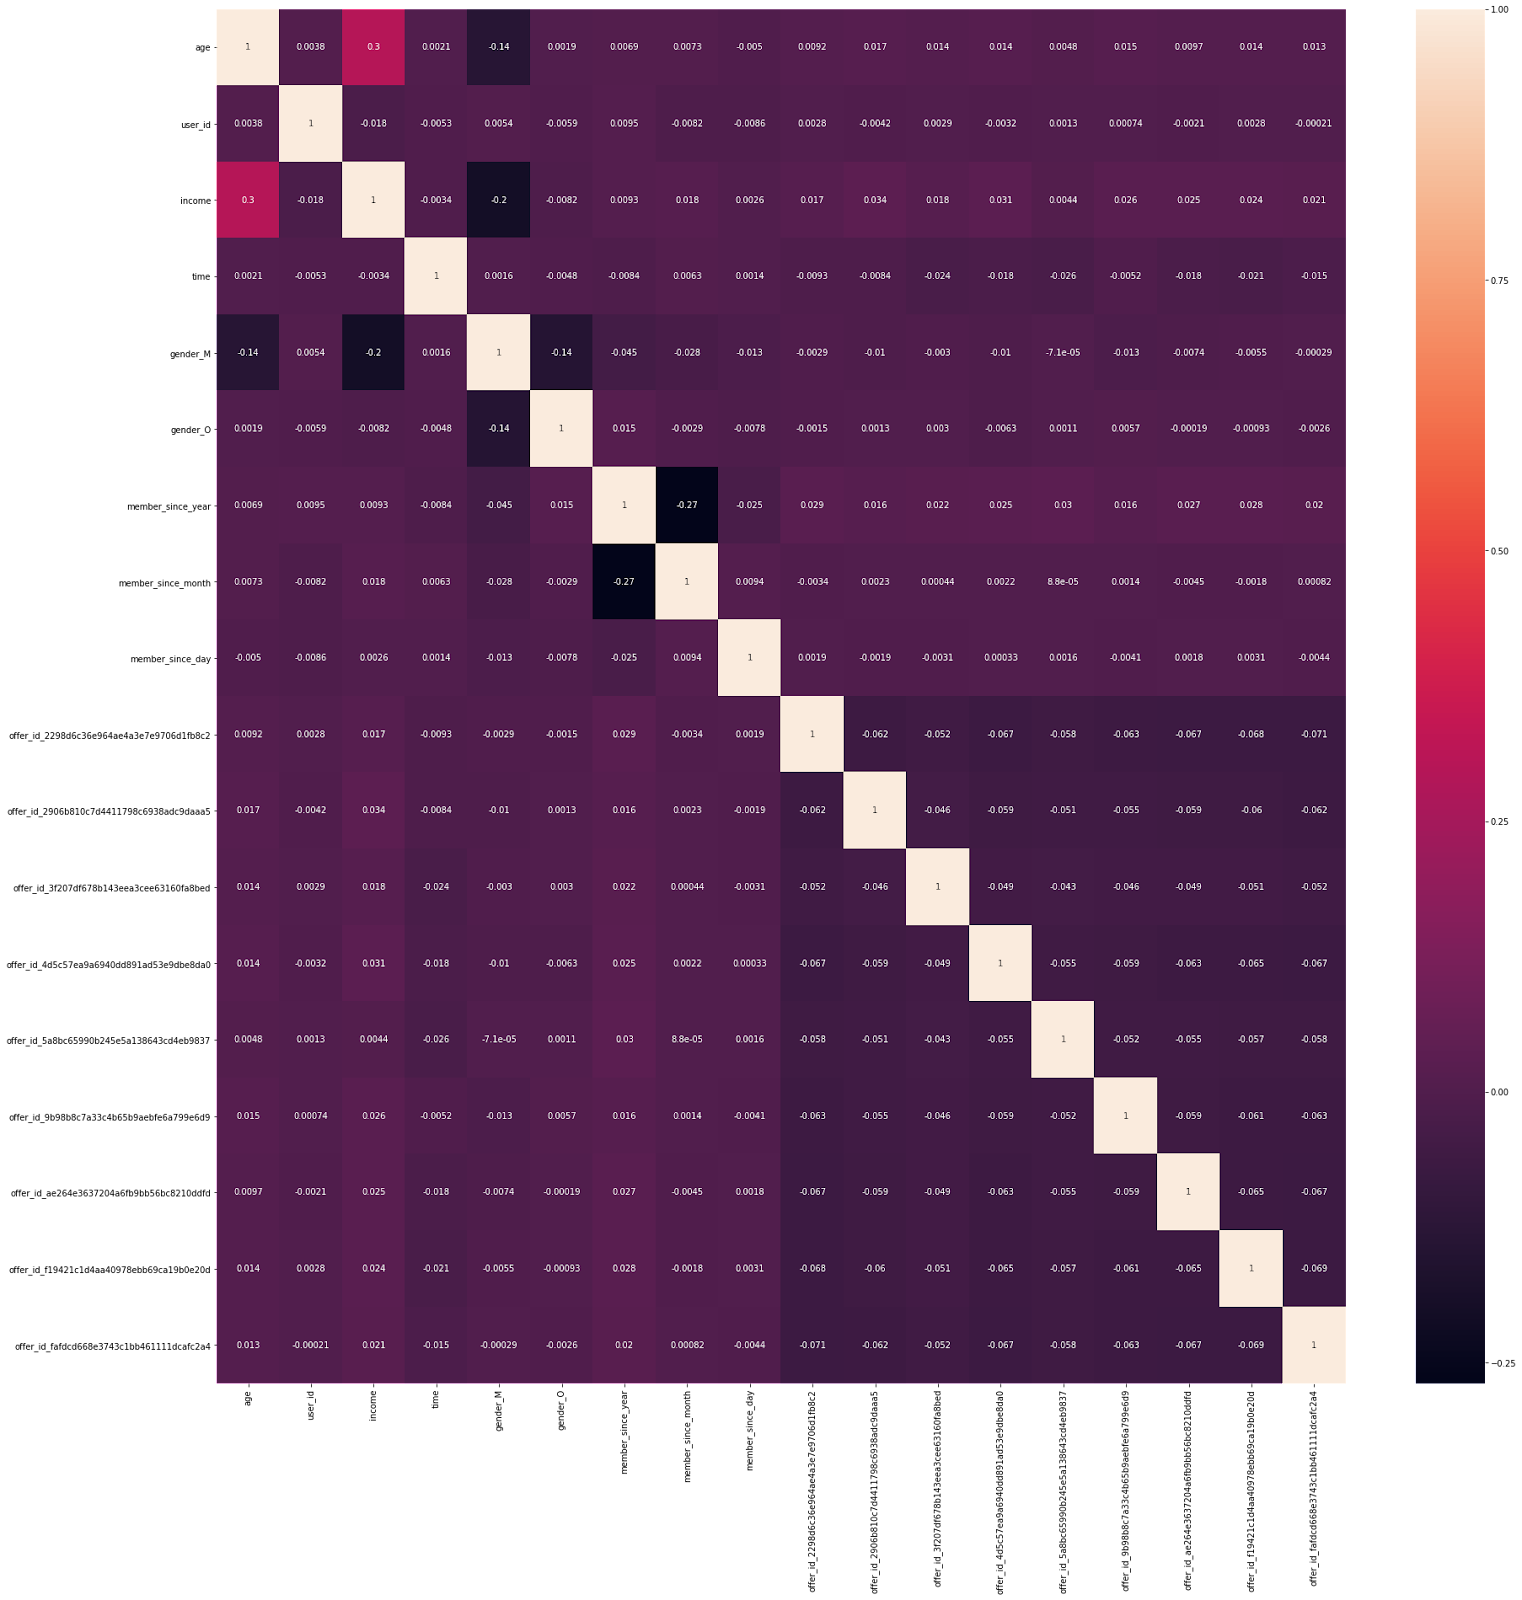
A heatmap is also provided to see the correlation among variables.
- Data Preprocessing
Before applying Random Forest Classifier to predict event_transaction being 0 or 1 (whether there is a transaction arised from the event or not), a couple of processing steps have been taken.
First, I get dummies of these variables: offer_type, offer_id, gender. In these cases, I prefer one-hot encoding to label encoding because these are not ordinal variables. However, in case of user_id, as there are too many user_id, I transform this column to be label encoded instead. Despite its cons, its pros is to save the memory size when conducting the data modelling.
Second, I extract day, month, and year from the original datetime column, representing the date a user joins Starbucks membership program.
Third, I get rid of null values by filling them with the mean of each continuous variable. Specifically, acknowledging that when there is a null value in amount column, it should be interpreted that the amount is 0. Therefore, in this particular column, I fill null with zeros.
- Modeling
Train set and test set are splited using train_test_split with the ratio 70:30.
X_train, X_test, y_train, y_test = train_test_split(X, y, test_size = .3)
Using RandomForestClassifier() as the main method
from sklearn.ensemble import RandomForestClassifier
rf = RandomForestClassifier()
Fit the train data X_train, y_train to random forest model
rf.fit(X_train, y_train)
Predict y based on X_test and trained model
y_pred = rf.predict(X_test)
Import classification_report and confusion_matrix to see the performance of this model. As a result, the f1-score of test set is 0.94, very good for the initial try.
from sklearn.metrics import classification_report, confusion_matrix
print(classification_report(y_pred, y_test))
print(confusion_matrix(y_pred, y_test))
- Hyperparameter Tuning
To revise the model, I apply GridSearchCV taking some slight changes in random forest classifier hyperparameters.
- Results
- Comparison Table


- Conclusion
- Improvements
In the next version, more algorithms should be employed to have a variety of results. Therefore, there might be a better forecasting ability of the model using the existing data.
- Acknowledgment
- References

Comments
Post a Comment